


Discovery
Digital Receipts Design Project

XYZ Bank

Summary
XYZ Bank* is a small local bank that wants to give customers more control and transparency into their spending.
Problem
XYZ is receiving hundreds of calls per week from customers wanting to clarify charges on their accounts that they believe to be fraud, but they are having a hard time handling the volume of calls .
Goal
XYZ Bank needs a new product that will reduce the amount of potential fraud clarification calls while helping customers understand their spending transactions.
*NOTE - XYZ Bank is a fictional entity and was created for this project example
XYZ Bank Background
Local regional bank in the Southwest
Each branch has 15 staff and 500-1000 customers
Only 6 physical branches but good online presense

XYZ Bank can only respond to fraud calls Monday-Friday from 9am-5pm.
Does not have enough employees at the corporate office to answer the amount of clarification calls they receive.
While some charges do result in fraud, the majority of the calls are customers requesting more information on a transaction and learning that the purchase is valid.
Plan
User segments

Individuals

User Types
Natasya
online shopper
Evelyn
In-store shopper
Daisy's Florals
Local Small Business
Businesses
Costmore Corp
Corporation
User Pain Point Assumptions with Fraud
Updating all saved payment information locations
Stolen
funds
Canceling a new card or closing an account
Not catching fraud immediately when there is a high volume of transactions
Merchants sometimes use unrecognizable description names for bank transactions
Can't recall what was purchased without receipt
Calling the bank and waiting on hold
User personas
Natasya
online shopper
Customer with XYZ Bank for 1 year
1 personal checking account &
1 credit card account
- Shops primarily online
- Buys from vendors all over the world
- Shops frequently (3-4 times/week)
- Flagged for fraud once every 3 months
- Makes purchase returns online
- Receives all purchase receipts via email
Costmore Corp
Corporation
Customer with XYZ Bank for 8 years
2 business checking accounts &
2 credit card accounts with 50 authorized users
- Makes high-value amount transactions
- Multiple employees making purchases
- High bank transaction volume per month
- Slower to detect potential fraud
- Saves both digital and physical receipts in a company online system
Build
product/ feature ideas

Vendor Approval Module
Module that allows customers to create a list of vendors that are approved to debit account
Work Required
- Designing
- Wireframing
- Prototypes
- Coding
- User input functionality
- Vendor matching functionality
- Notification functionality for non-matching vendors
- Testing
- Internal QA Testing
- External User Testing
Solves XYZ Bank's goal


Reduces fraud clarification calls
Helps customers understand spending transactions
Fraud Detection
Button
Button added to each bank transaction that allows customer to flag a purchase for further review
Work Required
- Designing
- Wireframing
- Prototypes
- Coding
- Functionality to send alert (email) to bank with selected transaction
- Functionality to let customer know notification was sent
- Testing
- Internal QA Testing
- External User Testing
Solves XYZ Bank's goal
Reduces fraud clarification calls
Helps customers understand spending transactions
Digital Receipts
Digitized copy of an itemized receipt attached to each purchase transaction for customer review
Work Required
- Designing
- Wireframing
- Prototypes
- Coding
- Functionality to assign/access/store itemized purchase info for every transaction
- Functionality to display itemized purchase info
- Functionality to print/save digital receipt
- Testing
- Internal QA Testing
- External User Testing
Solves XYZ Bank's goal
Reduces fraud clarification calls
Helps customers understand spending transactions
prioritization
Value
High Value, Low Effort
High Value, High Effort
Low Value, Low Effort
Low Value, High Effort
Effort
Vendor Approval
Fraud Button
Digital Receipts
Prioritization Based on Ease
1.
Fraud Button
2.
Vendor Approval
3.
Digital Receipts
Prioritization Based on Impact
1.
Digital Receipts
2.
Fraud Button
3.
Vendor Approval
For this project, I am choosing to base the prioritization on impact as I think digital receipts will give the client the most transparency into their spending but will also be the most impactful in eliminating potential fraud inquiries for XYZ Bank.
Pros & Cons of Digital receipts for xyz bank

Pros
- Provides customers transparency into their purchases
- Can recommend other bank products based on customer spending data
- Helps with merchant disputes

Cons
- Will need additional storage for displaying all the itemized purchase information
- May require a large amount of integrations to work with merchant processing companies to retrieve the itemized purchase information
- Retailers may not want to participate in providing the purchase information
SOLUTIONS TO THE CONS


Storage
XYZ could provide digital receipts for a smaller subset of merchants first to see how much storage it actually requires. Possibly starting with the merchants with the highest disputes.
Integrations
The amount of integrations may be too expansive for XYZ's internal engineering team to take on. It might make more sense to hire an outside vendor who focuses on collecting transaction data from merchants and integrating with them first.
Participation
Participation issues may arise with retailers who do not want to share purchase data. If XYZ cannot get itemized information, the next best step would be to provide the retailer's store front name in addition to their processing name as this may provide enough clarity to customers.
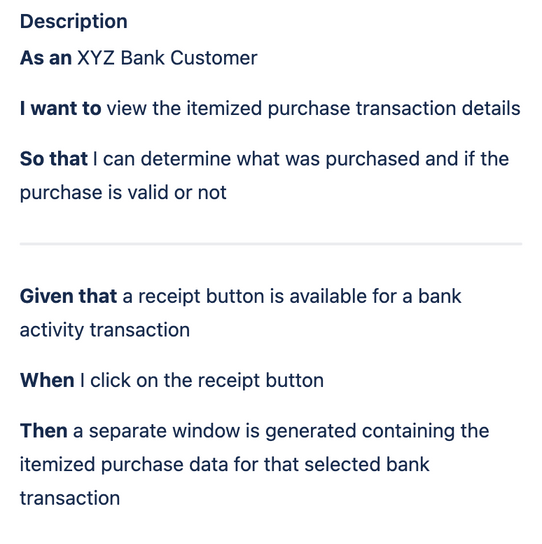
Release
Mockups
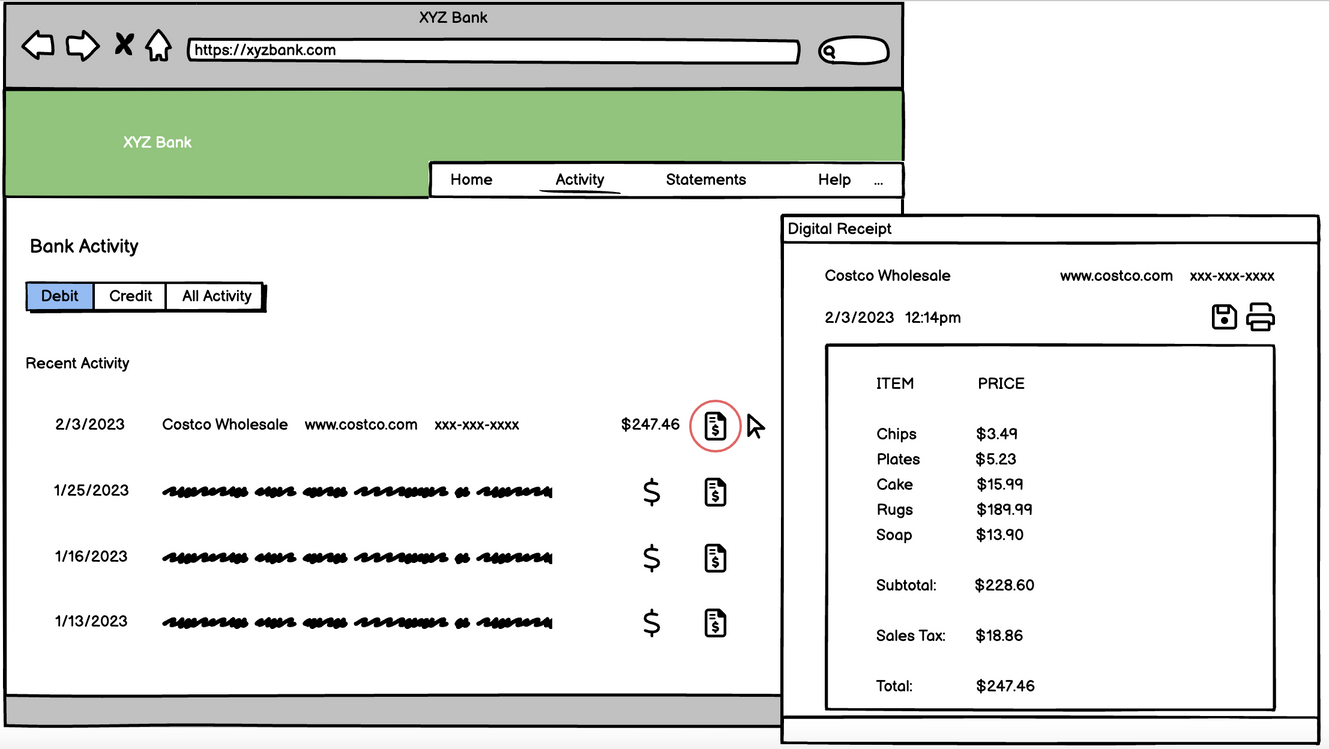
#1 - As a selection Within the bank activity
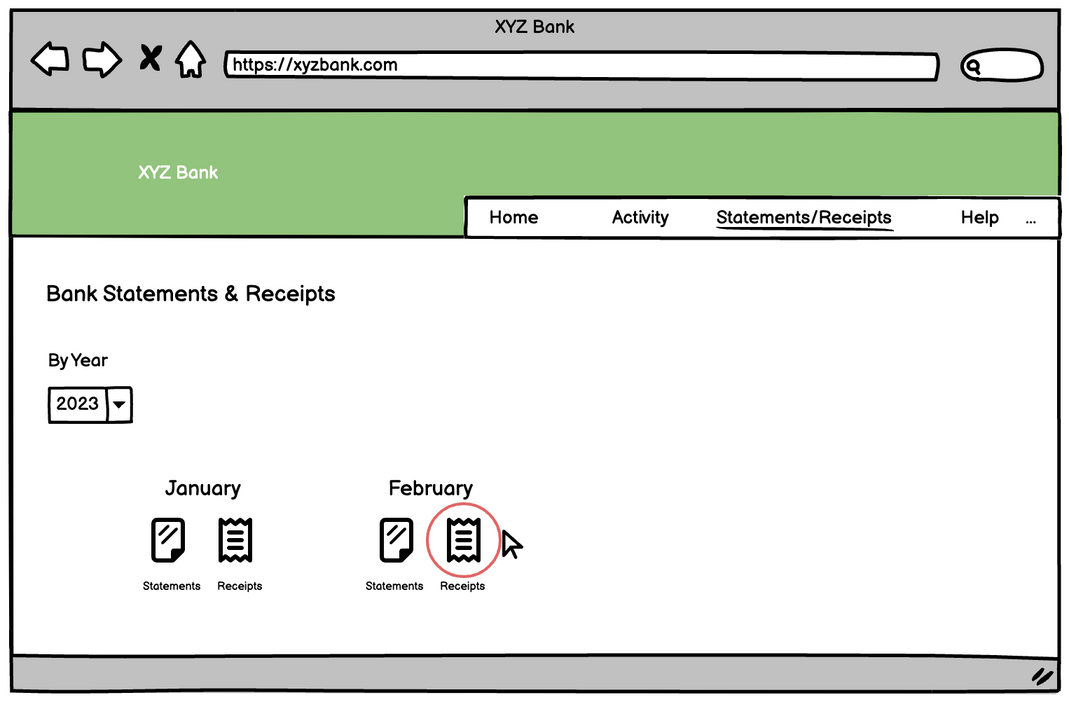
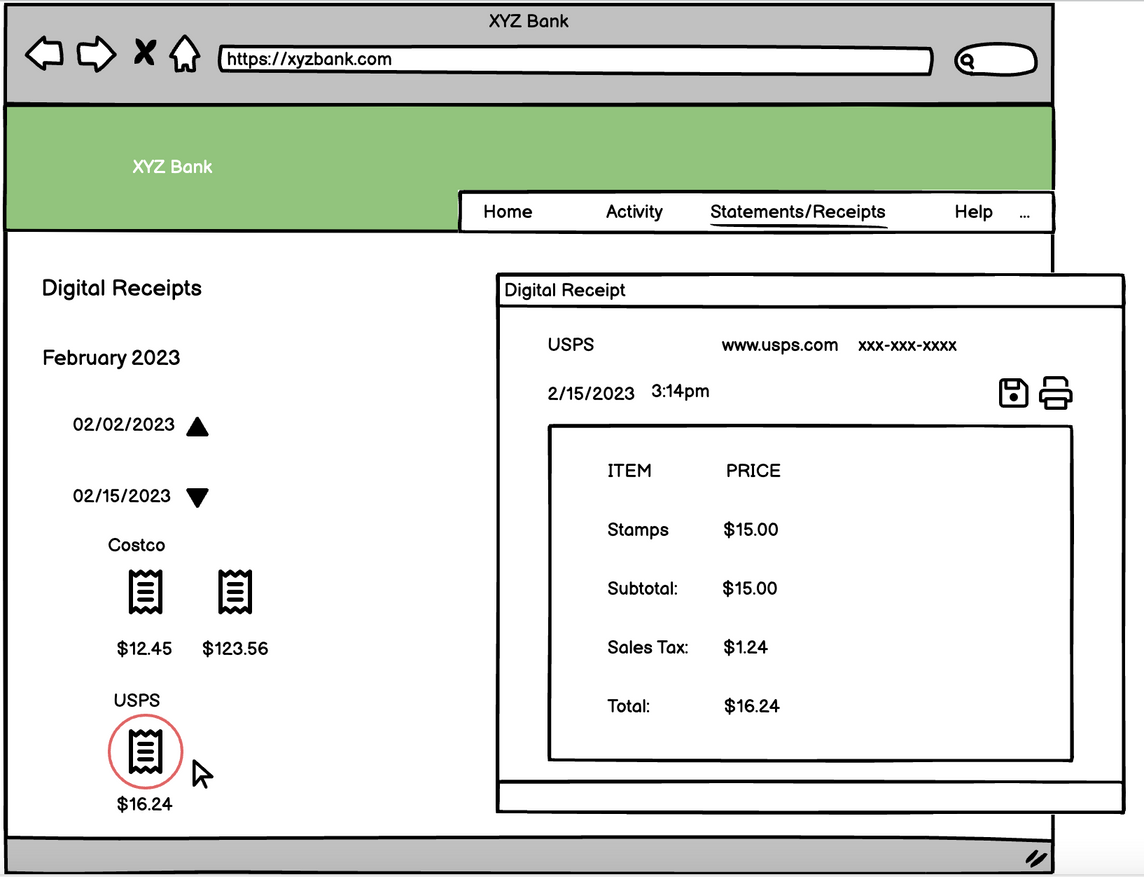
#2 - As aN addition to the statements functionality

metrics
Below are three metrics that can be used to determine if Digital Receipts is successful:
The number of customers who opt-in to use the Digital Receipts feature
This metric will determine how many users are adopting the feature
The number of digital receipts clicked/ viewed in a month
This metric will determine how many users are using the feature and how often once it is adopted
The change in the number of potential fraud calls received per month
This metric will determine if the original goal/problem is solved for XYZ Bank
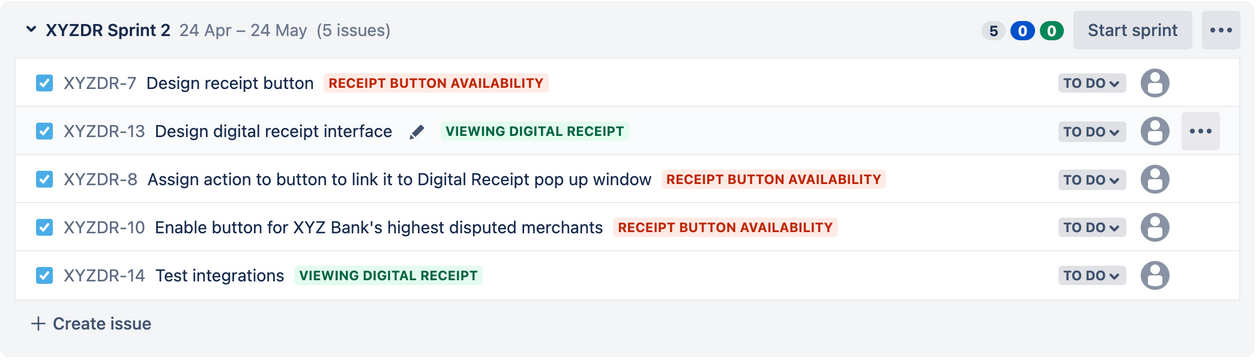
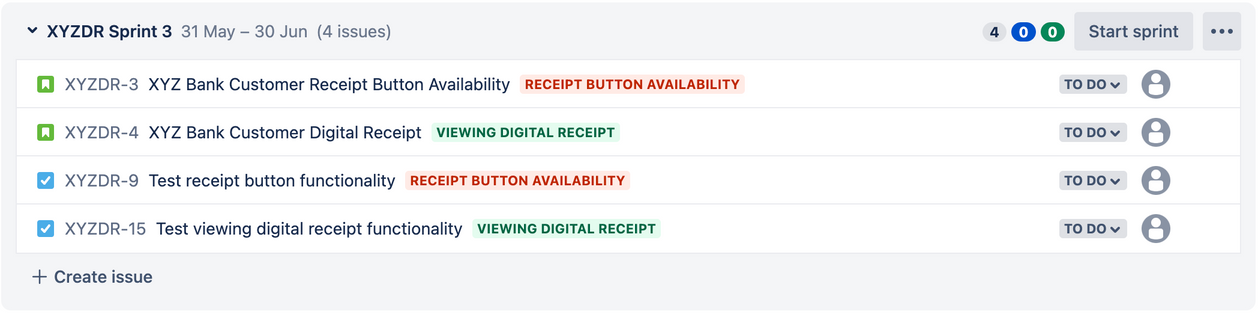
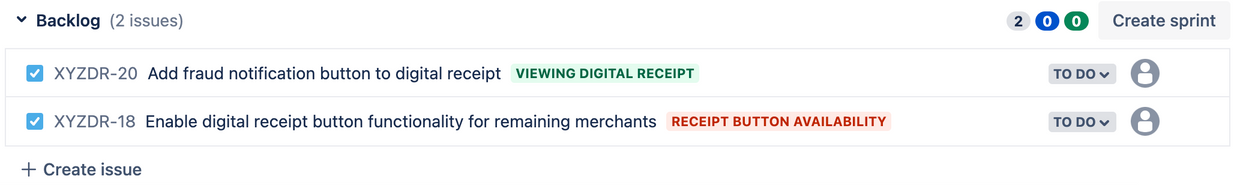
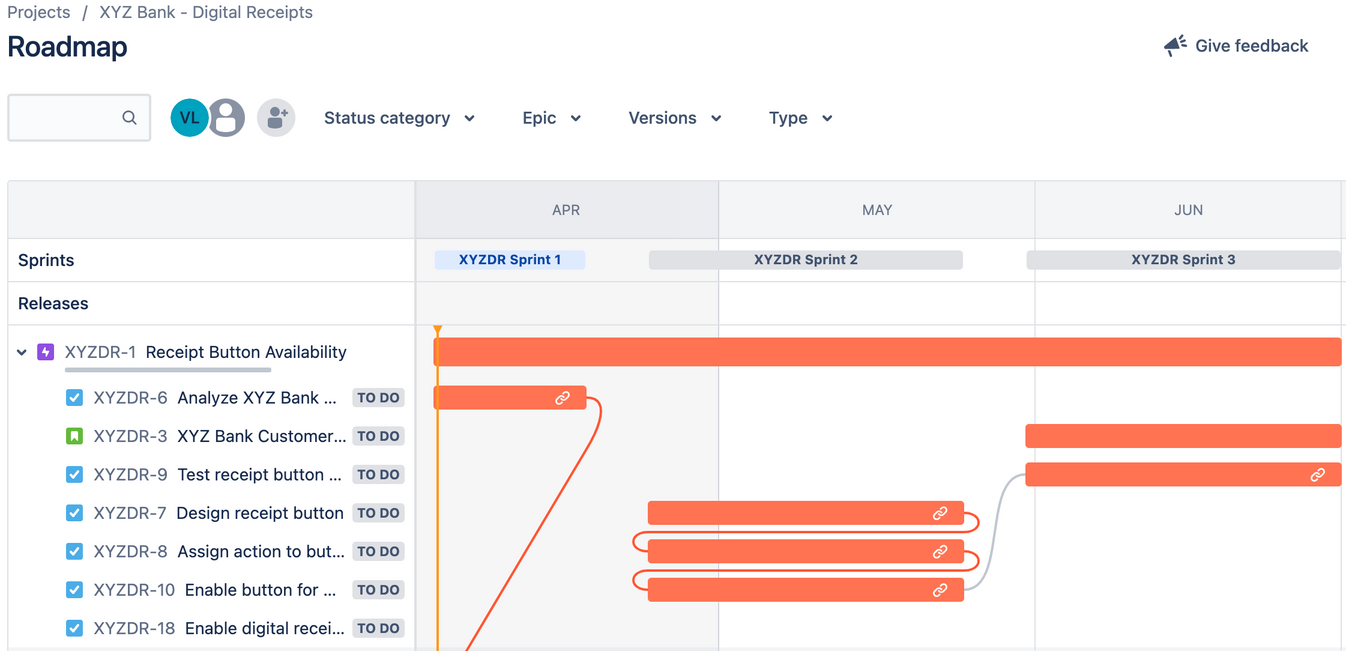
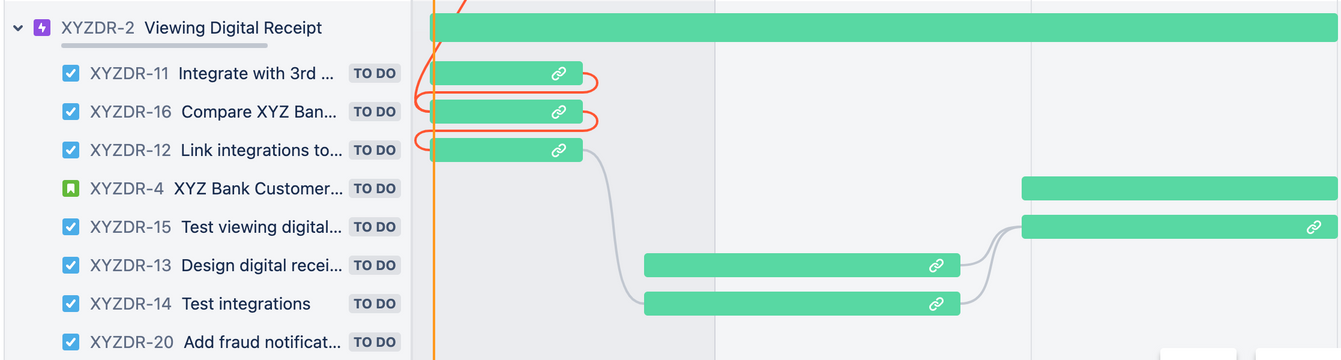
proposed Use Cases, sprints & roadmap
For this project, I am making the following assumptions to implement this feature for XYZ Bank:
- XYZ Bank will use a 3rd party company to handle the transaction integrations from merchants
- XYZ Bank will provide digital receipts for the the merchants with the most disputes
- XYZ Bank will provide the digital receipt functionality within the bank activity
XYZ Bank Customer Receipt Button Availability
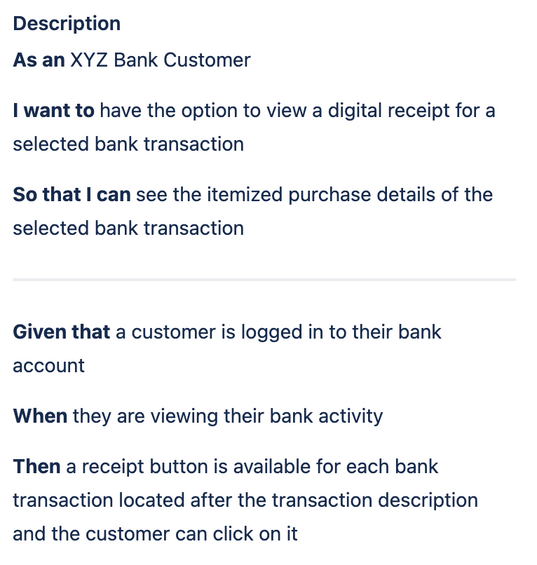
XYZ Bank Customer Digital Receipt Viewing

DISCOVERY
YouTube Channel Improvement Project
Check out my full channel here:

Moonglaze Designs Youtube channel

Channel Purpose
WHY: To share the Cuerda Seca painting technique in an approachable way with YouTube viewers
HOW: Using detailed step-by-step tutorials
WHAT: With videos ranging in length from 5 to 10 minutes
Goal
To hit the monetization requirements of 1000 subscribers and 4000 watch hours in order to earn revenue from the channel.


Channel Analytics & Evaluation
Before completing this project, I spent time analyzing the metrics of this YouTube channel as provided by YouTube.
The metric of focus I took from this analysis is the Average View Duration.
Click on the arrow to check out my original analysis

Channel Metrics - July 2022

Subscribers
243

Watch Hours
401

Total Videos
41


Average View Duration:
Estimated average minutes watched per view
The longer a video is watched, the more the YouTube algorithm will recommend your content
Cumulative Average View Duration of 41 Videos:
2 Minutes
Channel Evaluation Assumptions
Currently Working

Video Quality
Content Variation

possible problems
Short Average
View Duration
Wrong Target Audience
Niche Content
PRODUCT GOALS

To create Cuerda Seca content that visualizes the process


To hit the monetization requirements in order to earn revenue
Plan
USER SEGMENTS
WATCHING TO LEARN
- Users would be using keywords related to "ceramics" or "how to"
- Users could already be searching for Cuerda Seca/ ceramics content
- Users would be inclined to watch the videos to learn a process
- Users could already own supplies needed to follow technique

WATCHING FOR SATISFACTION
- Users would be using keywords related to "art" or "ASMR"
- Users would not have watched existing ceramics content or be recommended that content type
- Users would be inclined to watch the videos for satisfaction purposes
USER TYPES
Adult viewers looking for the Cuerda Seca technique
Adult viewers searching for ceramic
techniques

Adult viewers searching for "How to" content
Adult viewers searching for art content
Adult viewers searching for autonomous sensory meridian response (ASMR) content

USER PERSONAS
TRAITS
Juliet
ASSUMPTIONS
Role: Ceramicist, business owner
- Female, 35 years old
- Creative, DIYer
- Sells ceramic pottery
- Familiar with ceramics & ceramic painting techniques
- Unfamiliar with cuerda seca
- Watches video content about ceramics
- Already has access to ceramic supplies and equipment (ex. glazes and a kiln)
Watches YouTube to find inspiration for her ceramic products
Alex
Role: University Art Student
TRAITS
- Male, 22 years old
- Time conscious, visually stimulated
- Takes breaks throughout the school day
- Unfamiliar with ceramics & ceramic painting techniques
- Unfamiliar with cuerda seca
ASSUMPTIONS
- Watches video content about art
- Watches video content during breaks
Watches YouTube as a stress relief
USER PAIN POINTS
Technique Difficulty
Video Length - Too Short
Tutorial Format
Video Length - Too Long
Content Satisfaction
Video Audio - Talking vs Music
IMPROVEMENT GOAL

Increase video average view duration
to improve Youtube's algorithm recommendation
in order to increase subscribers and watch hours
which will help meet the monetization requirements
IMPROVEMENT IDEAS

POSSIBLE SOLUTIONS
Change tutorial formatting
Use broader SEO keywords in titles
Create an upload schedule
Split content into separate videos
Evaluate the outcomes of not changing anything
build
IMPROVEMENT PRIORITIZATION
YouTube is currently pushing a new feature called "YouTube Shorts" on the platform. This indicates to me that they are focused on this feature as well as creating a space for short-form content in order to gain user adoption. With this assumption in mind, I am prioritizing the following solution to achieve my primary goal as well as my personas' goals:

Split all video content into two videos
A longer video focused on technique
A shorter video focused on visuals
I would like to compare analytics from the two video forms and see if there is one form that performs better.
IMPROVEMENT PROS & CONS
Splitting the Videos
Utilize new YouTube shorts feature - Using YouTube to push more of my content to new viewers
More content to upload to YouTube - More content means more impressions/views/watch hours
Target a wider audience having two formats - Satisfy varying types of viewers interests
Use the shorter video format as a tool for discovery to the channel and longer video formats
Viewers may be more inclined to watch the short video format to completion, therefore possibly increasing average view duration
Shorter video format does not have monetization opportunities through ads currently*
Viewers only interested in short form content may not watch the longer videos posted to channel
*As of February 2023, YouTube has added monetization through ads to their shorts feature
IMPROVEMENT MOCKUPS
Longer Video format
video linking
Chapters
Youtube shorts
Video Max Length: 60 Seconds

IMPROVEMENT METRICS
Since my goal is to increase average view duration and hit the monetization requirements, the below metrics will be pulled for each video from YouTube analytics after the videos have been on YouTube for 30 days.


Average View Duration
Subscribers Gained
Watch Hours
Gained
Impressions

Views
00:00
Length of Video
%
View Duration Percentage
Release
VIDEOS UPLOADED - A/B TESTING
Long form

#1
#2
#3
#4
Short form

VIDEO METRICS RESULTS
#1
Long
#1
Short
#2
Long
#2
Short
#3
long
#3
Short
#4
long
#4
Short
Metrics
00:00
Length of Video
00:06:46
00:01:01
00:04:03
00:00:57
00:03:46
00:00:58
00:03:55
00:00:59
Average View Duration
00:02:04
00:00:32
00:01:18
00:00:34
00:01:16
00:00:31
00:01:14
00:00:38
Subscribers Gained
0
6
0
0
0
0
1
0
Watch Hours
Gained
2.8
8.5
0.8
1.7
0.7
6.0
1.0
1.5
Impressions
1845
154
332
212
259
292
597
194
Views
82
938
37
177
35
690
48
143
%
View Duration Percentage
31%
52%
32%
60%
34%
54%
31%
64%
- Data was collected for each video 30 days after video publish date from YouTube Analytics
- View Duration Percentage was calculated by dividing Average View Duration by Length of Video
Higher Performing
SUMMARY
Based on the above metrics chart, the following totals can be calculated between long form and short form in 30 days:
Metrics
Long
Form
vs
Short
Form
Subscribers Gained (Sum)
1
6
Watch Hours
Gained (Sum)
5.3
17.7
Impressions (Sum)
3033
852
Views (Sum)
202
1948
%
View Duration Percentage (Avg)
32%
58%
KEY TAKEAWAYS
In a 30-day time span, the short-form content performed higher in 4 out of the 5 metrics selected. In all, I think this new feature will be a good addition to the channel in order to possibly hit the monetization requirements sooner.
Watch Hours Gained
Looking at the data aggregately, I gained 3 times as many watch hours using the Shorts feature. While shorts have a smaller possible watch length, I suspect that the audience for this feature is currently much wider and all those smaller watch minutes are adding up to significant watch hours.
Subscribers Gained
From the aggregate data, it might appear that shorts outperformed long form by gaining 6 times as many subscribers. However, those 6 subscribers only came from 1 short. Rather than saying shorts were more successful, I think looking further into that first short to see why it performed better would be more beneficial in figuring out how to replicate that.
Impressions/ Views
While impressions and views don't tell me a whole lot about performance, I chose to look at them to see which content type YouTube was pushing to more potential viewers. The long-form content had 3.5 times more impressions, but the short-form content actually had 9 times more views. These views result in watch time that counts toward the watch hours requirement.
%
View Duration Percentage
This metric was important to look at because the YouTube algorithm focuses on content with higher view durations since audience retention is key. Seeing that all my shorts were above 50%, the YouTube algorithm may be more inclined to continue to push these shorts for a longer period of time which could result in additional watch hours and subscribers.
Youtube channel Data Analysis Project

Data Visualization Overview


Project Details
Objective
To perform exploratory analysis and visualization with Tableau on the data collected from my personal YouTube channel MoonGlaze Designs.
My intent with this analysis is to examine the data on a deeper level and analyze the insights of the current videos based on metrics that YouTube uses to determine channel performance.


Data Collected from youtube analytics module
- Video Title
- Video Publish Time
- Subscribers Gained
- Likes
- Dislikes
- Shares
- Subscriber Views
- Non Subscriber Views
- Watch Time (Hours)
- Average View Duration
- Impressions
- Impression Click Through Rate (%)

Current Channel Metrics
- Subscribers: 243
- Watch Hours: 401
- Number of Videos: 41
- Lifespan: 1 year, 7 months
Applications Used:
- Google Sheets
- Tableau
- MySQL
- QuickDBD
Languages Used:
- SQL
Data Integrity
Before the data is imported into mySQL some preliminary cleaning needs to be done on the data to correct the following:
- Fix formatting issues - Changing date format to approved mySQL date format and reduce extra decimal places for watch time
- Checking for NULL or wrong data values
- Check for data normalization - remove redundant information (Total views column, Total row)
- NOTE: Special characters are being left in the title description as they do affect how the youtube algorithm works for views.
I chose to use Google Sheets since the data did not require an extensive amount of cleaning coming from the YouTube Analytics Module.

Database SchemA Planning
I decided to keep all the data on one table because the values collected were specific to each video. There was not a many to one relation with the data where one video could have the same data as another video.
Due to this, it made more sense to leave the data to one table. Using a third-party website (QuickDBD), I visualized the columns, data types, and constraints of the main table I will be importing into mySQL.

Youtube's metrics
Per YouTube, the top aspects that the algorithm uses to determine channel performance are:
- Reach
- Impressions, Click-through Rate, Views
- Engagement
- Watch time, Average View Duration
- Audience
- Subscribers
SQL Functions Used:

- SUM()
- COUNT()
- ROUND()
- AVG()
- CAST()
- YEAR()
- TIME_TO_SEC()
- SEC_TO_TIME()
- DATEDIFF()
Key Performance Indicators
Based on YouTube's metrics, these are the KPIs and queries I will be reviewing:
- Reach
- Calculating the average impression click-through rate
- Determining which videos are performing higher than the average impression click-through rate
- Calculating the frequency of video uploads
- Showing the upload frequency by month and year
- Engagement
- What are the top 5 and bottom 5 videos with the highest watch hours?
- Calculating total average of the average view duration
- Determining which videos are performing higher than the overall average of the average view duration
- Audience
- Calculating the conversion rate of subscribers per views
- Calculating percentage of subscriber vs non-subscriber views per video
Calculations
SQL:
Percentage of Views by Subscriber Type:
- nonsubscriber_views/(subscriber_views + nonsubscriber_views)*100 AS percentage_of_nonsubscribers
- subscriber_views/(subscriber_views + nonsubscriber_views)*100 AS percentage_of_subscribers
Overall Average of Average View Duration:
- SEC_TO_TIME(AVG(TIME_TO_SEC(average_view_duration))) AS overall_average_duration
Average of Impression Click-through Rate:
- CAST(AVG(imp_clickthrough_rate) AS DECIMAL(3,2))
Frequency of Video Uploads:
- DATEDIFF((SELECT video_publish_date FROM video_data ORDER BY video_publish_date DESC LIMIT 1), (SELECT video_publish_date FROM video_data ORDER BY video_publish_date ASC LIMIT 1))/COUNT(*)
Ratio of Subscribers from Video Views:
- SUM(subscribers_gained)/SUM(subscriber_views + nonsubscriber_views)*100
Tableau:
Videos Performing Higher than Average View Duration:
- [Average view duration]>=[Average view duration Parameter]
Videos Performing Higher than Average Impressions Click-Through Rate:
- [Impressions click-through rate (%)]>=[Impressions click-through rate (%) Parameter]
Tableau Visualizations
Reach Metrics Dashboard

Analysis & Inferences
- With an upload frequency of 14 days, I should be uploading 2 videos per month or 24 videos a year to maintain consistency.
- Per the first visualization, there are 5 months below and 6 months above the 2 videos per month quota. I would like to compare the videos in the 5 lower months with the ones in the 6 higher months based on views, watch hours, and subscribers gained to see which videos performed better.
- As for the impression click-through rate, it looks like 21 out of the 41 videos have a CTR greater than 3.83%, meaning 51% of my videos are performing better than the channel average.
- In this 51%, there is an outlier video with a CTR of 8.02%. I would like to further identify what is making its CTR so much higher than the other videos and see how it can be repeated. Is it the thumbnail picture, the title description keywords, or maybe the length of time it's been published on Youtube contributing to its higher rate?
Link to Tableau Public Vizze for Interactive Features - https://tabsoft.co/3NH9xZ8
Tableau Visualizations
Engagement Metrics Dashboard

Analysis & Inferences
- Seeing that my total average view duration is 2 minutes, I can use this to adjust the length of future videos. If viewers are more compelled to watch a video around this time limit then they may also be likely to watch the video in its entirety. They may also be compelled to watch more of my videos consecutively if they are in this 2-minute format.
- The video with the highest view duration of approx. 4 minutes is a compilation type of video. I could plan to make more videos of the compilation type to see how they perform and determine if it is a popular content topic for my viewers.
- The video with the highest watch hours actually has a view duration below the average at 1:34 minutes. This tells me that even though people are not watching it for as long, it is getting so many views that the short viewing time is adding up to several watch hours.
Link to Tableau Public Vizze for Interactive Features - https://tabsoft.co/3NH9xZ8
Tableau Visualizations
Audience Metrics Dashboard

Analysis & Inferences
- The rate of converting subscribers per view is 1.94% which means that for every 1000 views my channel is gaining approx. 19 subscribers. The top 3 viewed videos are contributing to 45% of subscribers gained.
- The second-highest viewed video is gaining as many subscribers as the first highest viewed video even with approximately 900 fewer views. It would be worth comparing the two videos on an individual level within the Youtube analytics module to see if I can find what is causing people to subscribe to the second viewed video just as much as the first.
- More than 50% of my views for each video are coming from non-subscribers. And it looks like the more non-subscribers watch the video the higher total views it has, while the videos with a more even percentage of subscribers watching have fewer total views.
Link to Tableau Public Vizze for Interactive Features - https://tabsoft.co/3NH9xZ8

Olympics History Data Visualization Project
The purpose of this project was to format and visualize a data set from kaggle.com containing over 116K unique values related to the entire Olympic Games History for both Summer & Winter Seasons using SQL and Tableau.
FORMATTED DATA SET FILE

TRANSFORMED VISUALIZATIONS
SUMMER OLYMPICS

Link to Tableau Public Vizze for Interactive Features - https://tabsoft.co/3GNBUCO
WINTER OLYMPICS

Link to Tableau Public Vizze for Interactive Features - https://tabsoft.co/3GNBUCO